
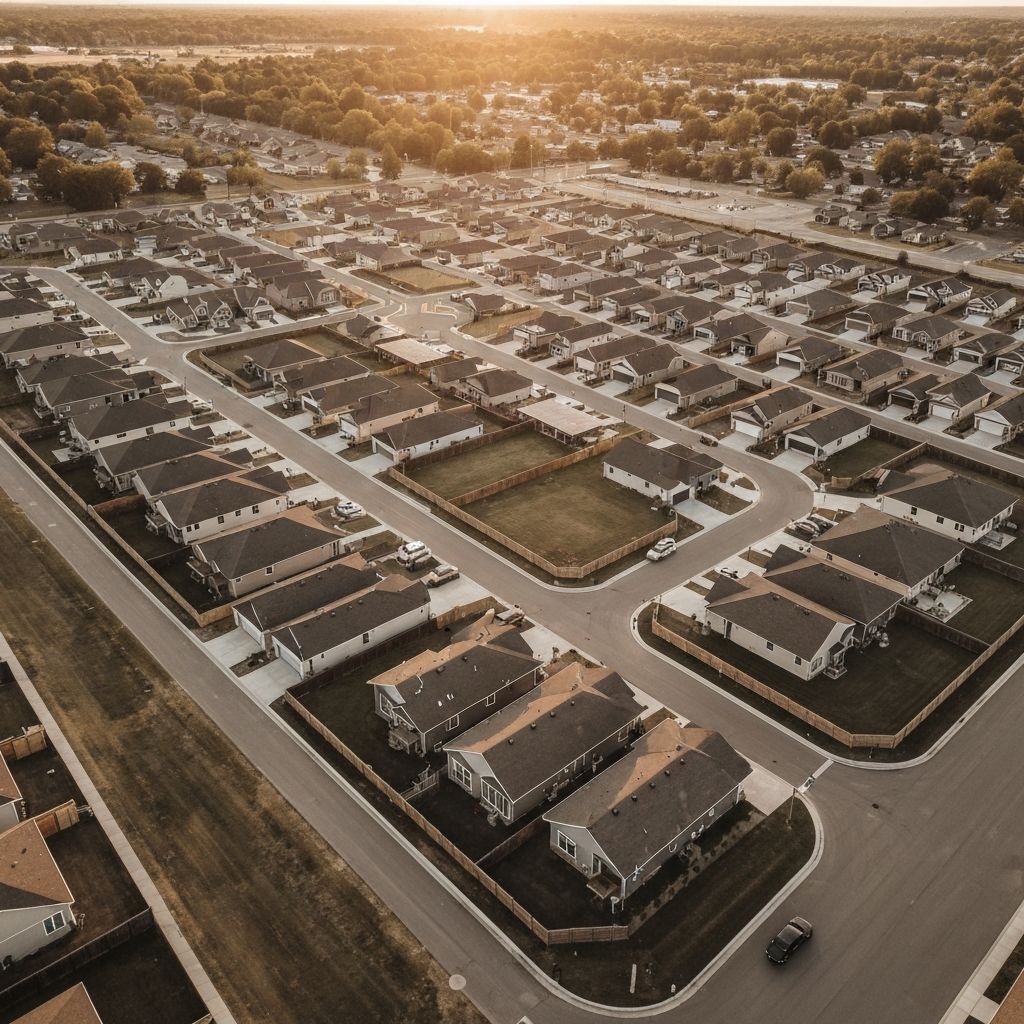
Rock Island County
Active LendingOpportunity ZoneRock Island County, Rock Island County · Davenport-Moline-Rock Island, IA-IL
Median Home Value
$152,355
Est. Cap Rate
5.4%
Based on rent yield × 65%
Vacancy Rate
8.3%
69% owner-occupied
Population
143K
Median income: $66,768
Rock Island County Investment Analysis
Rock Island County is a mid-size market of 143K residents with median home values at $152,355. The 5.4% cap rate indicates solid cash flow potential with room for value appreciation — a balanced market for both rental and value-add strategies. Strong 6.4% year-over-year appreciation signals continued demand — act before prices climb further. A healthy 31% renter population supports median rents of $1,058/month, providing reliable income streams for buy-and-hold investors. As your Real Estate CFO, we recommend exploring DSCR rental acquisition in Rock Island County. Get pre-qualified for $150K–$10M in financing — term sheet in 48 hours.
Market Details
Housing Stock
67K units
Single-family: 47K
Multifamily: 16K (23.5%)
Investment Metrics
Gross Yield 8.3%
Cap Rate 5.4%
Price-to-Rent 12.0 (Favors buying)
Property Tax $3,372/yr
Demographics
Median Income $66,768
Median Age 40.3
Employment 99.7%
Home Value Trends
1-Year Appreciation +6.4%
3-Year Appreciation +13.6%
5-Year Appreciation +23.6%
Rental Market
$1,058/mo
Renter population: 31.4%
Lending Status
Active Lending
$150K – $10M · Business purpose
Data sources: U.S. Census Bureau ACS 2023 5-Year Estimates · Zillow Home Value Index (Feb 2026) · USDV Capital analysis
Investment Strategy Assessment
How Rock Island County performs for each investment strategy
DSCR Rental
Strong MatchWith a 5.4% cap rate and 31.4% renter population, Rock Island County offers strong cash flow potential for buy-and-hold investors.
- Up to 85% LTV
- No income verification
- 5-30 year terms
Fix & Flip
Strong MatchLow vacancy (8.3%) indicates strong absorption — flipped properties sell quickly in Rock Island County.
- Up to 90% of purchase + rehab
- 6-18 month terms
- Draw schedule for rehab
Bridge / Value-Add
Strong MatchBridge financing works in any market condition. Use it for acquisitions, refinances, or transitional properties in Rock Island County while you stabilize or reposition.
- Up to 80% LTV
- 12-24 month terms
- Interest-only payments
Top Cities in Rock Island County
14 cities by population
| City | Population | Home Value | Cap Rate | |
|---|---|---|---|---|
| MolineRock Island County | 42K | $146,200 | 5.2% | View → |
| Rock IslandRock Island County | 37K | $122,020 | 7.1% | View → |
| East MolineRock Island County | 21K | $145,535 | 4.4% | View → |
| SilvisRock Island County | 8K | $156,120 | 4.9% | View → |
| MilanRock Island County | 5K | $184,375 | 3.4% | View → |
| Coal ValleyRock Island County | 4K | $261,909 | — | View → |
| Port ByronRock Island County | 2K | $298,295 | 1.4% | View → |
| HamptonRock Island County | 2K | $202,442 | 3.9% | View → |
| AndalusiaRock Island County | 1K | $201,417 | 3.6% | View → |
| Rapids CityRock Island County | 1K | $237,890 | — | View → |
| Coyne CenterRock Island County | 906 | $178,045 | — | View → |
| CordovaRock Island County | 633 | $222,048 | 3.4% | View → |
| HillsdaleRock Island County | 489 | $154,113 | 4.0% | View → |
| Illinois CityRock Island County | 18 | $267,987 | — | View → |
Top Neighborhoods in Rock Island County
17 neighborhoods
Calculate Your Rock Island County Investment Returns
Run the numbers on any property. Get your full analysis emailed to you instantly.
Property Details
Investment Projection
$69
2.2%
1.32
$823
Monthly P&I: $799 | Est. Expenses: $190
Get Your Full Analysis
Receive a detailed PDF with 5-year projections, tax implications, and financing scenarios.
Rock Island County Investment Report
Comprehensive county market analysis
Get the Complete Rock Island County Market Analysis
Make data-driven investment decisions with our comprehensive county report, including pricing trends, rental yields, and DSCR loan scenarios.
- Complete market data & demographics
- 5-year price appreciation trends
- Rental yield analysis by property type
- Investment opportunity score
- Comparable market benchmarks
- DSCR loan scenario modeling
Top 10 Cities in Rock Island County for DSCR Investment
Our data team analyzed every citie in Rock Island County to find the best opportunities for cash-flowing DSCR investments.
Top 10 Cities
Rock Island County | DSCR Investment
Compare Your Financing Options for Rock Island County
Not all investment loans are created equal. See how DSCR loans stack up against traditional financing.
DSCR Loan
USDV Capital
6.5% - 8.5%
Up to 80%
Conventional Loan
Traditional Banks
6.0% - 7.5%
Up to 80%
Hard Money
Private Lenders
10% - 15%
Up to 70%
Get the Complete Financing Guide
Download our comprehensive guide covering DSCR loans, conventional financing, hard money, bridge loans, and more. Includes rate comparisons, qualification requirements, and scenario-based recommendations.
- 20+ page PDF guide
- Rate comparison charts
- Qualification checklists
Your Real Estate CFO
We don't work for one lender — we work for you. As your Real Estate CFO, we shop the full institutional market to structure the best capital solution for your Rock Island County deal. Close in 28 days or we pay you $1,000.
$1.3B+
Transactions Advised
42
States Active
28 Days
Or $1,000 Guarantee
Flexible Financing for Every Deal
All products below are eligible for our 28-day close guarantee.
Bridge Loans
Short-term financing for acquisitions, refinancing, or repositioning
- 12-24 month terms
- Up to 80% LTV
- Interest-only payments
- Flexible prepayment

Fix & Flip
Fast funding for property renovation and resale
- 6-18 month terms
- Up to 90% of purchase + rehab
- Fast closings
- Interest-only payments
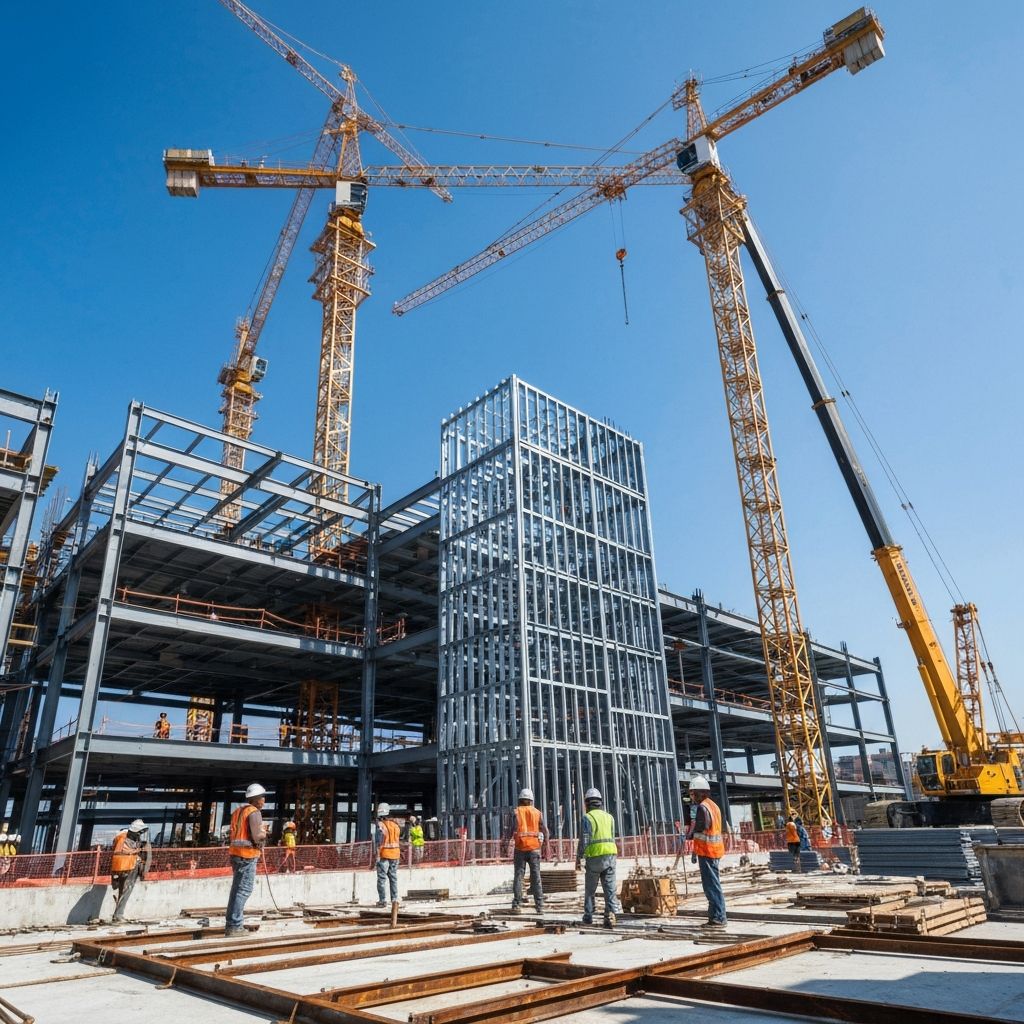
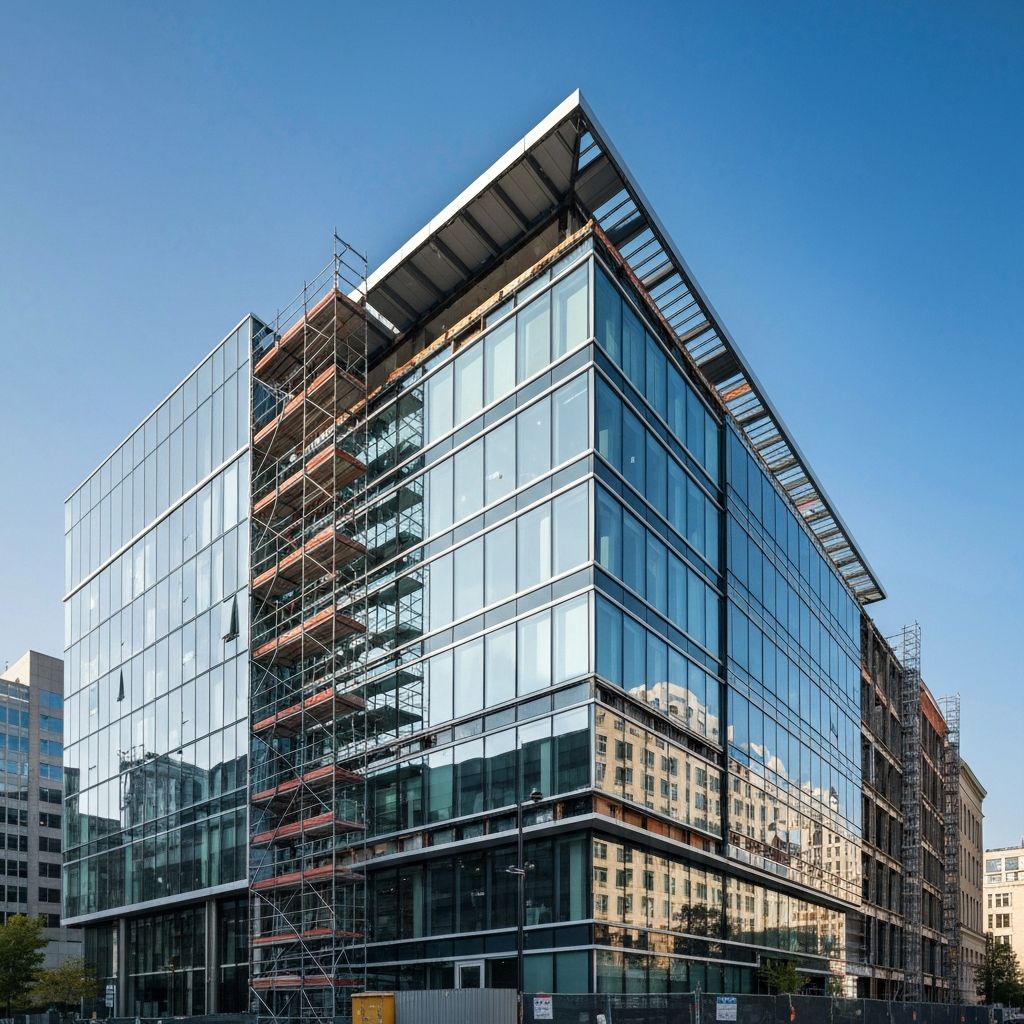
Ground-Up Construction
Financing for new development projects from land to completion
- 12-36 month terms
- Up to 90% of costs
- Progress-based draws
- Interest-only payments

DSCR Rental
Long-term financing for single-family rentals and portfolio acquisitions
- 5-30 year terms
- Up to 85% LTV
- Portfolio options
- No personal income docs
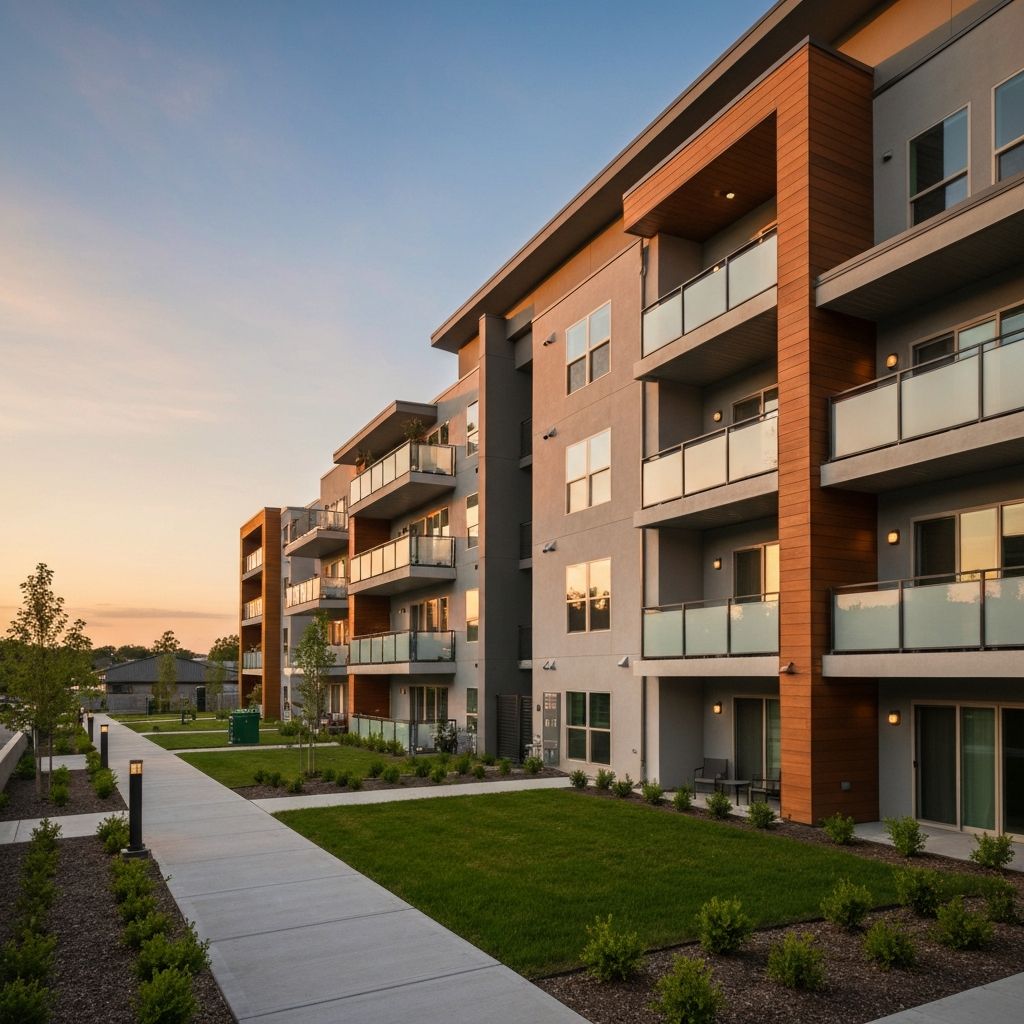
Larger Deals
Multifamily & Build-to-Rent
For multifamily and build-to-rent community financing up to $50M, we work directly with institutional capital partners on custom terms. These deals require a consultation — not a form.
Multifamily
Permanent and bridge financing for apartment buildings and complexes — 5 units and up.
- Up to $50M
- 5–30 year terms
- Up to 80% LTV
- Bridge and permanent options
- Interest-only available
Build-to-Rent Communities
Institutional financing for single-family rental community developments from land to stabilization.
- Up to $50M
- Construction through permanent
- Community-scale underwriting
- Progress-based draw schedule
- Custom closing timeline
Looking for 1-4 unit investment properties? Check out our standard lending products for DSCR, fix & flip, and bridge loans.
Your Real Estate CFO
We structure, source, and close financing for your investment properties. Let us help you capitalize on Rock Island County opportunities.
48-Hour
Term Sheet
$150K-$10M
Loan Range
28-Day
Close Guarantee
$1,000 GUARANTEE
If we can't close in 28 days, we pay you $1,000