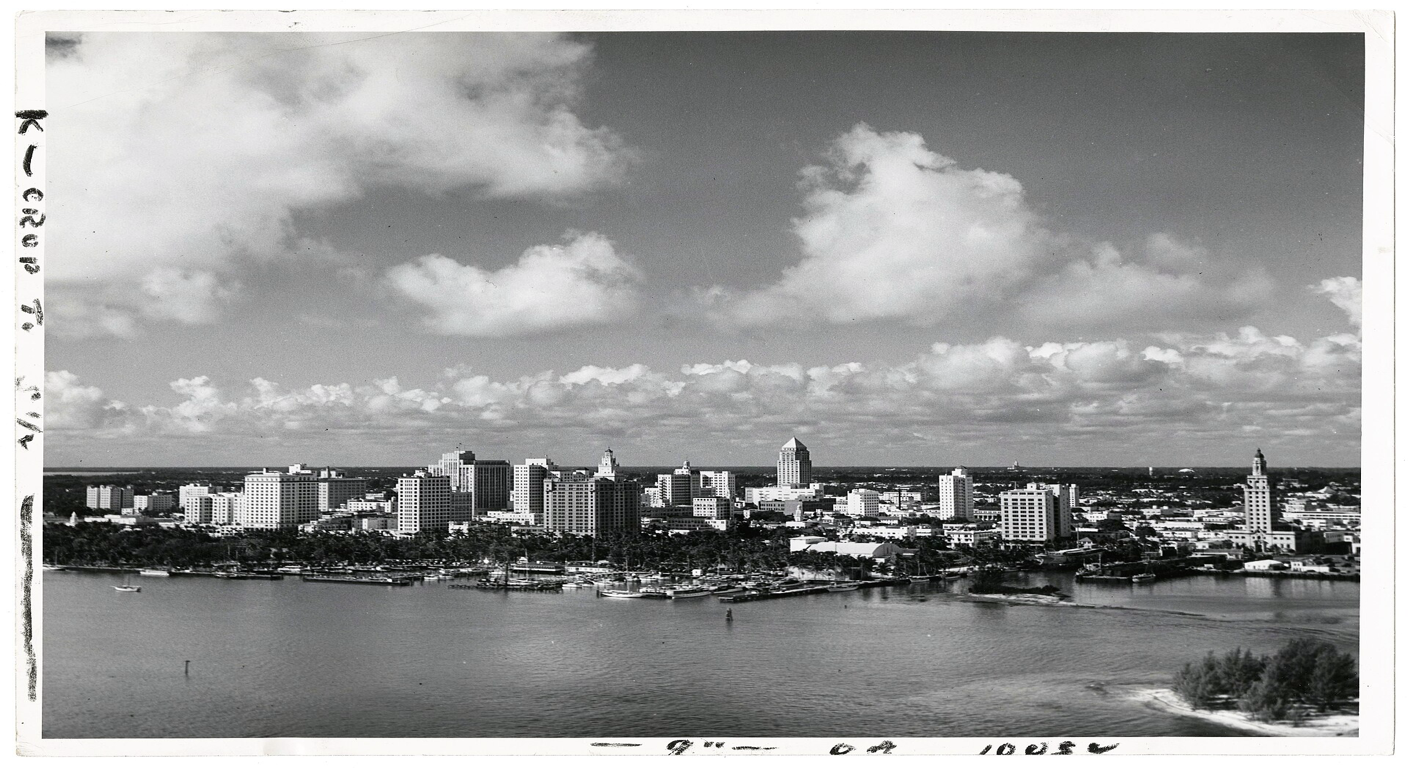
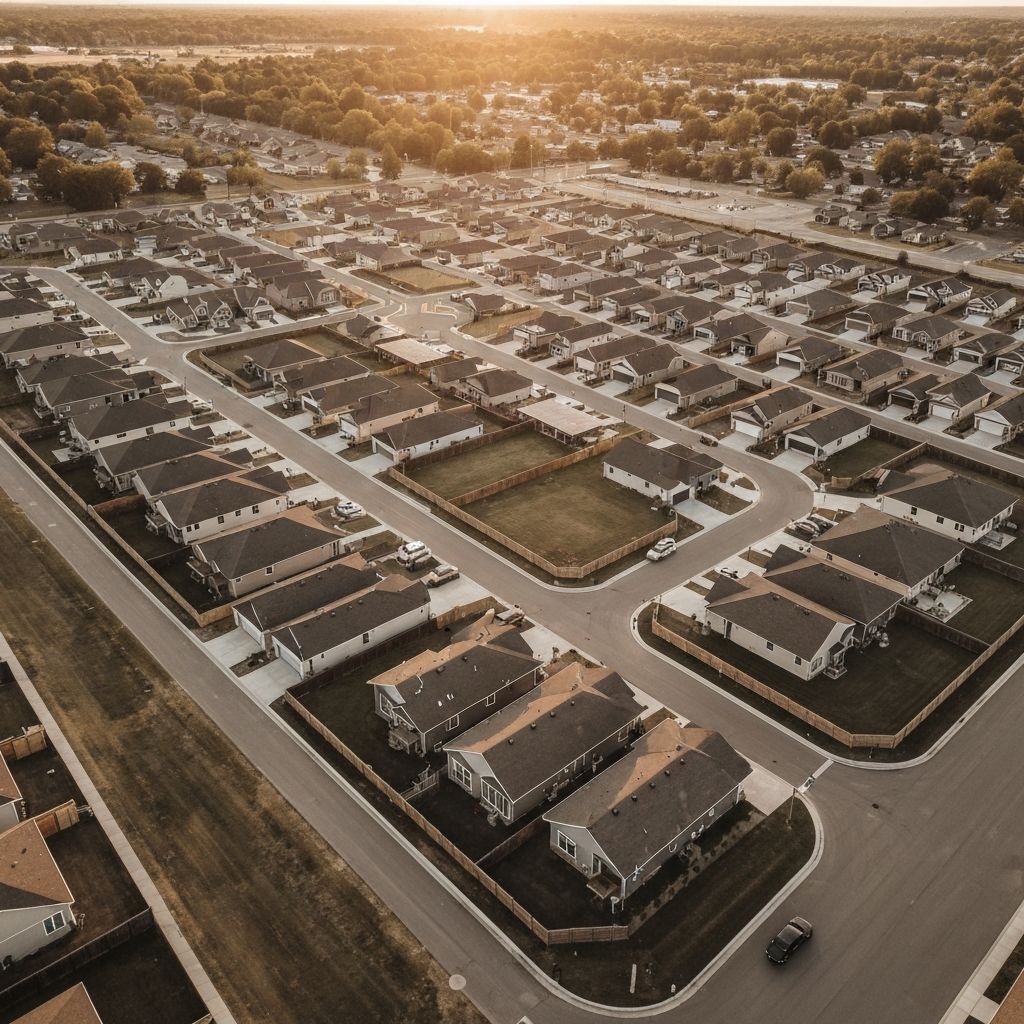
Miami-Dade County
Active LendingOpportunity ZoneMiami-Dade County, Miami-Dade County · Miami-Fort Lauderdale-Pompano Beach, FL
Median Home Value
$515,479
Est. Cap Rate
4.2%
Based on rent yield × 65%
Vacancy Rate
11.1%
52% owner-occupied
Population
2.7M
Median income: $68,694
Miami-Dade County Investment Analysis
Miami-Dade County is a major metropolitan market with 2.7M residents and a median home value of $515,479. The 4.2% cap rate indicates solid cash flow potential with room for value appreciation — a balanced market for both rental and value-add strategies. A modest 3.4% year-over-year decline suggests the market is cooling — favorable for buyers negotiating from strength. With 48% of the population renting at a median of $2,795/month, Miami-Dade County has exceptionally strong rental demand — a key indicator for DSCR loan qualification. Miami-Dade County's housing stock is 50% multifamily — indicating strong institutional investor interest and potential for 2-4 unit or small multifamily acquisitions. As your Real Estate CFO, we recommend exploring value-add rental or BRRRR strategy in Miami-Dade County. Get pre-qualified for $150K–$10M in financing — term sheet in 48 hours.
Market Details
Housing Stock
1.1M units
Single-family: 428K
Multifamily: 538K (49.6%)
Investment Metrics
Gross Yield 6.5%
Cap Rate 4.2%
Price-to-Rent 15.4 (Balanced)
Property Tax $3,516/yr
Demographics
Median Income $68,694
Median Age 40.8
Employment 99.8%
Home Value Trends
1-Year Appreciation -3.4%
3-Year Appreciation +7.7%
5-Year Appreciation +47.6%
Rental Market
$2,795/mo
Renter population: 47.8%
Lending Status
Active Lending
$150K – $10M · Business purpose
Data sources: U.S. Census Bureau ACS 2023 5-Year Estimates · Zillow Home Value Index (Feb 2026) · USDV Capital analysis
Investment Strategy Assessment
How Miami-Dade County performs for each investment strategy
DSCR Rental
Strong MatchWith a 4.2% cap rate and 47.8% renter population, Miami-Dade County offers strong cash flow potential for buy-and-hold investors.
- Up to 85% LTV
- No income verification
- 5-30 year terms
Fix & Flip
ModerateVacancy at 11.1% — factor in longer hold times when modeling your flip ROI in Miami-Dade County.
- Up to 90% of purchase + rehab
- 6-18 month terms
- Draw schedule for rehab
Bridge / Value-Add
Strong MatchBridge financing works in any market condition. Use it for acquisitions, refinances, or transitional properties in Miami-Dade County while you stabilize or reposition.
- Up to 80% LTV
- 12-24 month terms
- Interest-only payments
Top Cities in Miami-Dade County
41 cities by population
| City | Population | Home Value | Cap Rate | |
|---|---|---|---|---|
| MiamiMiami-Dade County | 447K | $573,963 | 4.0% | View → |
| HialeahMiami-Dade County | 222K | $439,844 | 4.3% | View → |
| Miami GardensMiami-Dade County | 111K | $464,022 | 4.6% | View → |
| Miami BeachMiami-Dade County | 81K | $518,750 | 4.2% | View → |
| HomesteadMiami-Dade County | 81K | $436,039 | 4.3% | View → |
| DoralMiami-Dade County | 76K | $545,219 | 4.2% | View → |
| North MiamiMiami-Dade County | 59K | $410,416 | 4.2% | View → |
| The HammocksMiami-Dade County | 59K | $531,182 | 3.5% | View → |
| TamiamiMiami-Dade County | 51K | $604,607 | 2.5% | View → |
| Coral GablesMiami-Dade County | 49K | $1,491,732 | 1.7% | View → |
| Cutler BayMiami-Dade County | 44K | $557,022 | 4.1% | View → |
| North Miami BeachMiami-Dade County | 43K | $440,579 | 4.0% | View → |
| AventuraMiami-Dade County | 39K | $424,850 | 5.7% | View → |
| Golden GladesMiami-Dade County | 35K | $458,885 | 3.9% | View → |
| West Little RiverMiami-Dade County | 33K | $429,941 | 4.6% | View → |
Top Neighborhoods in Miami-Dade County
92 neighborhoods
Alhambra Heights
Allapattah
Allen Park
Amber Creek East
Andover
Andover Lakes
Bayshore
Belle Isle
Biscayne Island
Biscayne Point
Brentwood
Alameda - West Flagler
Calculate Your Miami-Dade County Investment Returns
Run the numbers on any property. Get your full analysis emailed to you instantly.
Property Details
Investment Projection
-$553
-5.1%
1.03
-$6,631
Monthly P&I: $2,703 | Est. Expenses: $644
Get Your Full Analysis
Receive a detailed PDF with 5-year projections, tax implications, and financing scenarios.
Miami-Dade County Investment Report
Comprehensive county market analysis
Get the Complete Miami-Dade County Market Analysis
Make data-driven investment decisions with our comprehensive county report, including pricing trends, rental yields, and DSCR loan scenarios.
- Complete market data & demographics
- 5-year price appreciation trends
- Rental yield analysis by property type
- Investment opportunity score
- Comparable market benchmarks
- DSCR loan scenario modeling
Top 10 Cities in Miami-Dade County for DSCR Investment
Our data team analyzed every citie in Miami-Dade County to find the best opportunities for cash-flowing DSCR investments.
Top 10 Cities
Miami-Dade County | DSCR Investment
Compare Your Financing Options for Miami-Dade County
Not all investment loans are created equal. See how DSCR loans stack up against traditional financing.
DSCR Loan
USDV Capital
6.5% - 8.5%
Up to 80%
Conventional Loan
Traditional Banks
6.0% - 7.5%
Up to 80%
Hard Money
Private Lenders
10% - 15%
Up to 70%
Get the Complete Financing Guide
Download our comprehensive guide covering DSCR loans, conventional financing, hard money, bridge loans, and more. Includes rate comparisons, qualification requirements, and scenario-based recommendations.
- 20+ page PDF guide
- Rate comparison charts
- Qualification checklists
Your Real Estate CFO
We don't work for one lender — we work for you. As your Real Estate CFO, we shop the full institutional market to structure the best capital solution for your Miami-Dade County deal. Close in 28 days or we pay you $1,000.
$1.3B+
Transactions Advised
42
States Active
28 Days
Or $1,000 Guarantee
Flexible Financing for Every Deal
All products below are eligible for our 28-day close guarantee.
Bridge Loans
Short-term financing for acquisitions, refinancing, or repositioning
- 12-24 month terms
- Up to 80% LTV
- Interest-only payments
- Flexible prepayment

Fix & Flip
Fast funding for property renovation and resale
- 6-18 month terms
- Up to 90% of purchase + rehab
- Fast closings
- Interest-only payments
Ground-Up Construction
Financing for new development projects from land to completion
- 12-36 month terms
- Up to 90% of costs
- Progress-based draws
- Interest-only payments

DSCR Rental
Long-term financing for single-family rentals and portfolio acquisitions
- 5-30 year terms
- Up to 85% LTV
- Portfolio options
- No personal income docs
Larger Deals
Multifamily & Build-to-Rent
For multifamily and build-to-rent community financing up to $50M, we work directly with institutional capital partners on custom terms. These deals require a consultation — not a form.
Multifamily
Permanent and bridge financing for apartment buildings and complexes — 5 units and up.
- Up to $50M
- 5–30 year terms
- Up to 80% LTV
- Bridge and permanent options
- Interest-only available
Build-to-Rent Communities
Institutional financing for single-family rental community developments from land to stabilization.
- Up to $50M
- Construction through permanent
- Community-scale underwriting
- Progress-based draw schedule
- Custom closing timeline
Looking for 1-4 unit investment properties? Check out our standard lending products for DSCR, fix & flip, and bridge loans.
Your Real Estate CFO
We structure, source, and close financing for your investment properties. Let us help you capitalize on Miami-Dade County opportunities.
48-Hour
Term Sheet
$150K-$10M
Loan Range
28-Day
Close Guarantee
$1,000 GUARANTEE
If we can't close in 28 days, we pay you $1,000